From Columns to Area
Students turn displayed heights into finite area contributions, compare two partitions on one board, and judge whether the estimates are stabilizing.
Exercise 1 · Estimation Before Formalization Companion Exercises
Learning Objective
Students will construct left- and right-end area estimates for y = x² on [0, 1], explain why width must be included, interpret floor and stone scale correctly, and describe what improves when the partition is refined.
Teacher Overview
This activity connects the article's discussion of Wallis with a modern calculation using finite columns. Wallis studied quadrature through arithmetic patterns and infinite procedures; students here use rectangular sums. Both approaches examine how numerical patterns can help determine an area, although the classroom calculation is not Wallis's proof.
The app displays 11 columns, so one validated board can show x = 0, 0.1, …, 1. Students first select every other column to make five rectangles of width 0.2, then use all ten intervals to make ten rectangles of width 0.1. The app supplies values; students calculate area in a separate table. It does not calculate the area automatically.
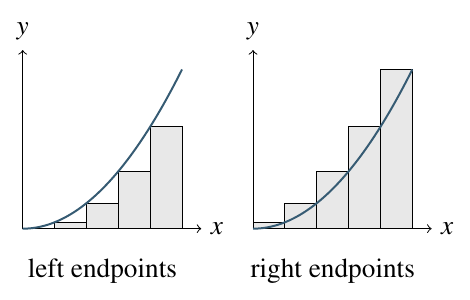
Figure 1: Five left-end rectangles lie below y = x²; five right-end rectangles lie above it.
Student Activity
Setup: validate before class
Open the web Calculus Abacus and choose Show panels. Set:
| Setting | Value |
|---|---|
| Formula | x^2 |
| Midpoint | 0.5 |
| Increment | 0.1 |
| Max stones | 80 |
| Options | Fractional stones; 10 decimals (optional) |
| Action | Fill Board |
The expected columns run from 0 to 1; the floor is 0; the maximum value is 1; one size stone is worth 1/80 = 0.0125. If the floor is not zero, stop and recheck the range. Do not use visible height as area until students have identified both the baseline and the horizontal width.
PREDICT. The curve rises from 0 to 1. If each rectangle uses the height at its right edge, will the result be below or above the true area? What about left-edge heights? Explain without calculating.
INTERPRET THE DISPLAY. Record the floor, the value of one size stone, and the increment. Explain what a stack at x = 0.7 represents. Then explain why a height of 0.49 is not yet an area.
CONSTRUCT FIVE CONTRIBUTIONS. Use Figure 1 and the points 0, 0.2, 0.4, 0.6, 0.8, 1.0. Record both endpoint heights, multiply each by the common width 0.2, and add each contribution column.
| interval | width | left height | left contribution | right height | right contribution |
|---|---|---|---|---|---|
| [0, .2] | .2 | ||||
| [.2, .4] | .2 | ||||
| [.4, .6] | .2 | ||||
| [.6, .8] | .2 | ||||
| [.8, 1] | .2 | ||||
| Totals |
REFINE. Now use every interval of width 0.1, with right edges 0.1, 0.2, …, 1.0. Calculate
R₁₀ = 0.1 (0.1² + 0.2² + ⋯ + 1.0²)
Do not refill the board: refinement here is a paper-and-abacus hybrid using the values already displayed.
| interval | width | left height | left contribution | right height | right contribution |
|---|---|---|---|---|---|
| [0, .1] | .1 | ||||
| [.1, .2] | .1 | ||||
| [.2, .3] | .1 | ||||
| [.3, .4] | .1 | ||||
| [.4, .5] | .1 | ||||
| [.5, .6] | .1 | ||||
| [.6, .7] | .1 | ||||
| [.7, .8] | .1 | ||||
| [.8, .9] | .1 | ||||
| [.9, 1] | .1 | ||||
| Totals |
BRACKET AND COMPARE. Repeat with left-edge heights. For five intervals use 0, 0.2, 0.4, 0.6, 0.8; for ten use 0, 0.1, …, 0.9. Place all four estimates in order on a number line. How does the gap between the left and right estimate change?
INTERPRET. Decide whether the estimates provide evidence for a stable area near 0.333. Describe the evidence without using the phrase “because the rectangles get smaller” alone.
Reflection Questions
- Why must each displayed height be multiplied by a width before it contributes to area?
- Which evidence is stronger: one close-looking estimate, or a narrowing bracket from two methods? Why?
- If the display floor were −2, what would the visible stacks measure, and what correction would area from the x-axis require?
Teacher Discussion Extension
Ask students to derive the bracket width without recomputing every square. For an increasing function with equal widths, the right and left sums differ only through the first and last heights:
Rₙ − Lₙ = Δx [f(1) − f(0)] = 1/n
What does this identity say about reliability as n increases? It gives a concrete error interval before formal integration.
What Students Often Notice
- A tall last column can dominate visual attention, even though every contribution has the same narrow width.
- Right-end estimates decrease while left-end estimates increase; the target is squeezed between them.
- The 11-column limit does not prevent comparison: one display can support two partitions.
- A zero floor simplifies the mathematics as well as the display.
Expected Student Discoveries
Students should find L₅ = 0.24 < R₅ = 0.44 and L₁₀ = 0.285 < R₁₀ = 0.385. The first bracket has width 0.20; the refined bracket has width 0.10. Both contain 1/3, and refinement narrows the interval of plausible values.
Common Misconceptions
- Adding heights only. This produces a dimensionless total of function values, not area. Attach the width to every contribution.
- Treating stone count as the function value. Convert using the stated value per size stone and restore the floor when necessary.
- Claiming the app integrated the curve. The app displayed values; students constructed the finite sum.
- Calling the activity Wallis's method. Keep the connection at arithmetic pattern, quadrature, and refinement.
Teacher Notes and Mathematical Check
For n equal intervals, the right sum is
Rₙ = (1/n) ∑ᵢ₌₁ⁿ (i/n)² = (n + 1)(2n + 1)/(6n²),
and Lₙ = Rₙ − 1/n. Thus
| n | width | left estimate | right estimate | bracket width |
|---|---|---|---|---|
| 5 | 0.2 | 0.240 | 0.440 | 0.200 |
| 10 | 0.1 | 0.285 | 0.385 | 0.100 |
The exact modern integral is 1/3. That value is a check for the teacher, not evidence students should substitute for the refinement argument.
Connection to the Historical Article
The companion article uses Wallis to frame patterns, finite sums, and quadrature. Here students meet those topics through a modern rectangular-sum calculation. The abacus helps them construct and refine the estimate; the procedure remains distinct from Wallis's proof.
Classroom Timing and Adaptation
Allow about five minutes for prediction and display interpretation, fifteen for the five- and ten-interval calculations, ten for bracketing and discussion, and five for an exit response. Pairs can divide the arithmetic: one student checks size values while the other records widths and running totals, then they exchange roles for the refined partition.
For additional support, provide the heights but leave widths and contributions blank. For additional challenge, ask students to predict L₂₀ and R₂₀ from the formulas in Teacher Notes and state the new bracket width before calculating either endpoint. A physical-board class can use the same table: the board supplies selected heights, while paper carries the multiplication and accumulation.
Quick Formative Assessment
Ask for a three-part exit statement: “A column height represents . . .; an area contribution represents . . .; I trust the refined estimate more because . . .” A successful response mentions width and gives evidence from the narrowing left/right bracket, not simply that the second calculation used more rectangles.
Written for the Calculus Abacus Project by Hamza Amin, with AI assistance, 2026.